s-Parameter Analyzer

Simplifying the understanding

of complex RF Systems

System Concept

System- and debugging work is based on a good system understanding and a well-structured system concept

Critical System Parameter

S-parameters  can be used to match input and output impedance, calculate the reflection loss and investigate how the system performance is impacted by adding a specific component to the network.

Smith Diagram

To get an idea about the system parameters and the system performance of RF systems the usage of the Smith Diagram has been helpful for generations of engineers.

Visualization of Scattering parameters

Sparavis is helping engineers to work on design concepts and understand measurement results by providing easy to use tools for the visualization of s-parameters. Sparavis S-parameter Analyzer helps to minimize your computing and EDA cost! For a lot of tasks during the system concept phase and in the measurement lab this cost-effective and easy to use tool is faster and more effective to use than most RF and Microwave Analysis and Simulation tools. It also uses less computing resources. Use the flagship tools and compute intensive applications only in areas where they are really needed to make the best out of your time and budget!

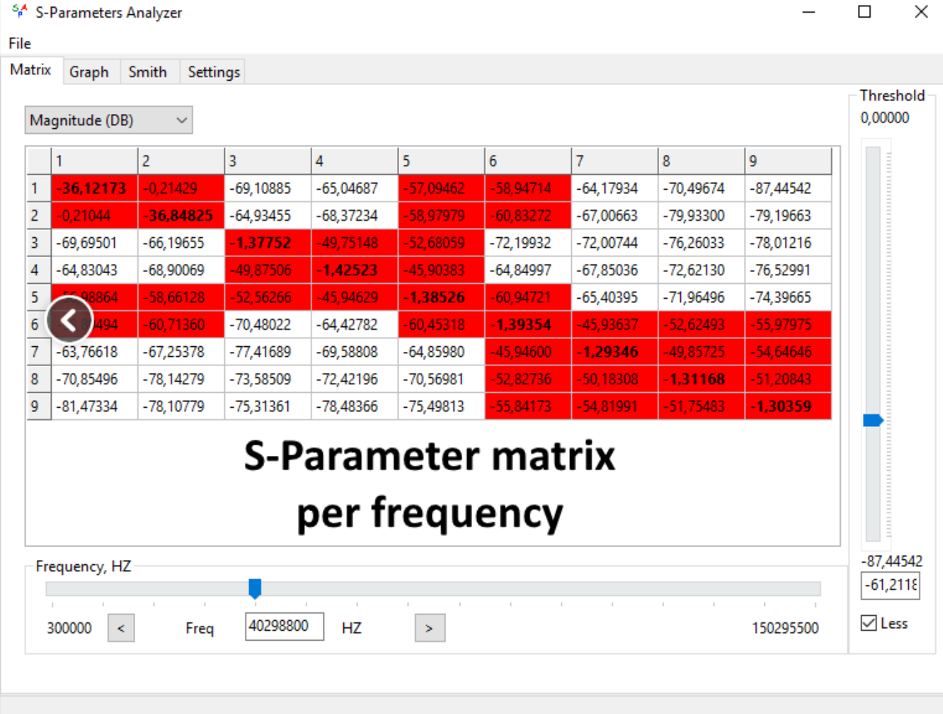
Engineers that create concepts for Radio Frequency electronics are usually dealing with complex systems. Most commercial EDA vendors are focusing on the complex computing to analyze or simulate the design. This requires high sophisticated and usually very expensive tools. Nevertheless, a lot of system work and debugging work is based on a good system understanding and a well-structured system concept. In this stage of the work engineers deal with critical system parameters like S-parameters. Such parameters can be used to match input and output impedance, calculate the reflection loss and investigate how the system performance is impacted by adding a specific component to the network.

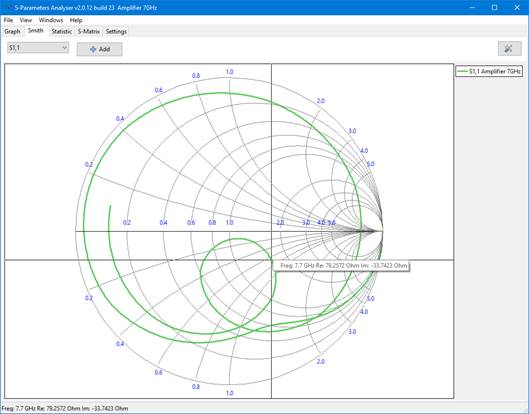
Most engineers have learned during their educations that it is essential to have a expectation before starting to simulate or measure a system. Otherwise it’s not possible to judge if the results can be right or if there is a systematic problem in the measurement or simulation setup. To get an idea about the system parameters and the system performance of RF systems the usage of the Smith Diagram has been helpful for generations of engineers.

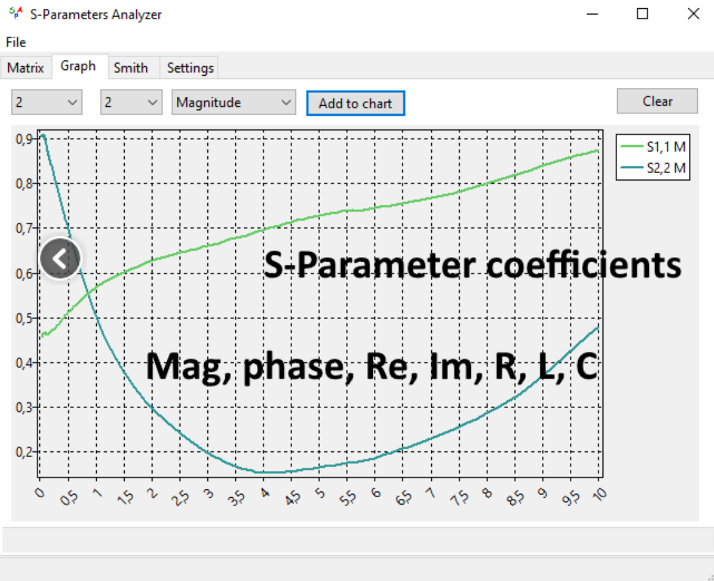
Looking to the current landscape of EDA tools our RF consulting engineers found that there is a gap between sitting  in front of a white paper sheet and starting to evaluate some basic ideas of a system and starting an active design or simulation project in one of the advance RF or Microwave design tools. What they were looking for, was a light and flexible tool to visualize S-Parameters and play with the basic system characteristics to specify designs or interpret simulation or measurement results. Since they were not able to find a ease to use light tool for those work packages, they have started to create a new EDA tool that ended up in our sparavis solution.

  • Single or multiport components

    Matching of single or multiport components in a network like antennas or filters,

  • Critical Parameters

    Understanding impact of critical parameters like return loss and reflections by adding low noise amplifiers or power amplifiers to the system.

  • Signal and power integrity

    Signal and power integrity analysis

  • Simulation Results

    View of measurement or simulation results

  • Comparing Options

    S-Parameters comparing between different implementation options

  • Comparing Goals

    Comparing implemented design vs specification goals

S-PARAMETER ANALYZER Views

Innovative view and analysis of S-Parameters. RF, mmWave, Signal and power integrity application. Visualization helps to get a quick overview about the critical system parameters and also helps to see the impact of a certain design change or the impact of a certain bug.

Matrix View

The Matrix support formats from S1P, S2P S3P, to SNP. The coefficients are the numbers of rows and lines.

You can insert the measurements directly from matrix to the rect. Chart. This makes it easier to work with many coefficients.

Graph View of S-Parameter Coefficients

Possible Measurements:

  • Magnitute (DB)
  • Angle
  • Real
  • Imaginary
  • Inductance
  • Capacitance

Smith Diagram View

The diagram shows impedance in 50 Ohm base Re and Im parts as hint and frequency. This way you can see the resistance and capacitance or inductance at that frequency. The values can be seen on the Rectangular charts and are usually part of the specification. The smithchart gives a very good insight during the design phase as it shows the nature of S-parameters. You can display the complex values in the specification using SmithCharts.